Releases
EPOS Release 24.3 - Discover the Highlights
Version 24.3 of EPOS is now available for download!
Read more

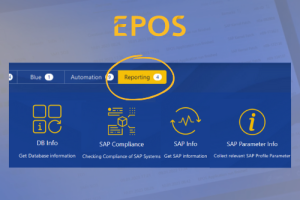
Create evaluations and audits at the push of a button with the new Reporting Engine.
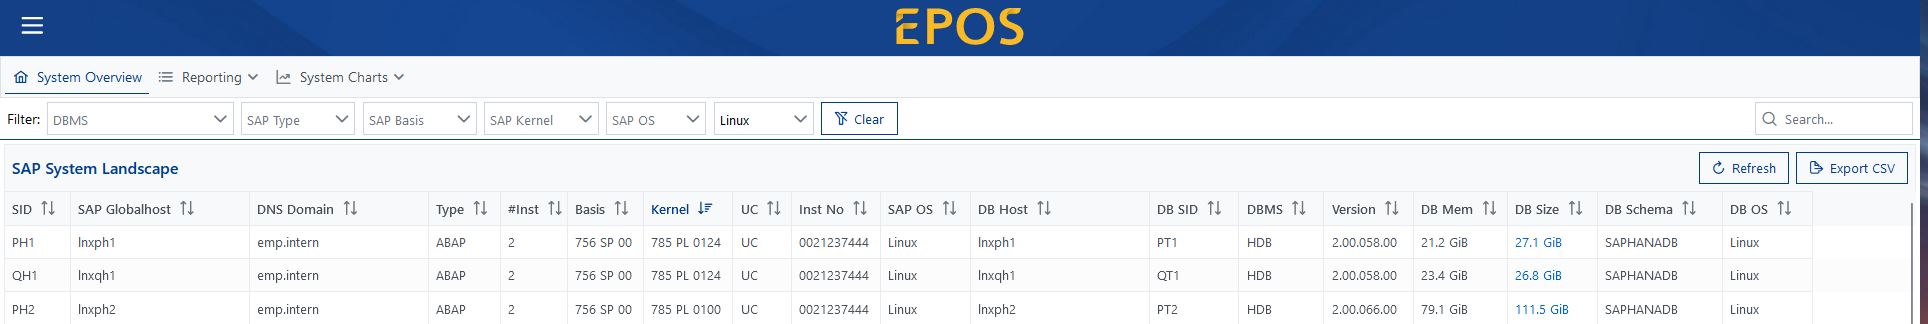
EPOS collects a variety of data from your databases, operating system and SAP systems, e.g. release statuses, parameter settings, information about the systems such as available disk space, memory, etc.
All this data is collected by our so called collectors and are stored in EPOS.
Until now this data could only be viewed via the individual collector and its respective summary table.
NEW: The new Reporting Dashboard makes viewing all of your data a lot easier.
Filter and group your systems according to certain criteria to see all information at a glance:
More detailed information can then be viewed via different entry points.
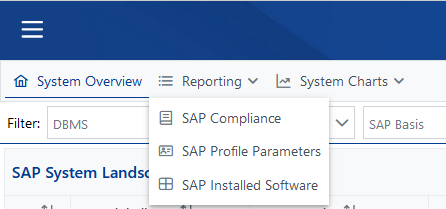
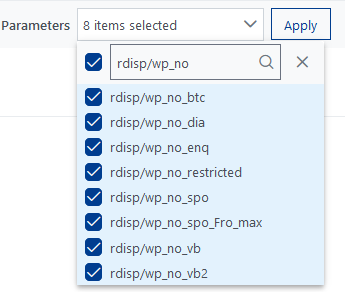
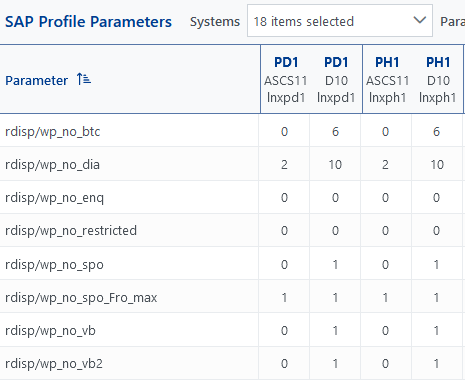
For example, if you want to know how certain parameters are set, you can do it as follows:
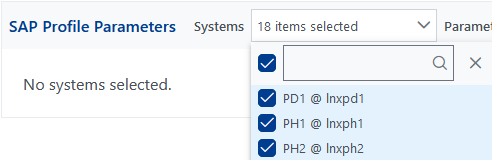
Either select directly in the list, or search for parameters via the input, then select them.
BEST PRACTICE:
Schedule all collectors regularly in the EPOS job scheduler - to take place once a week or even on a daily basis => set the frequency depending on how up-to-date you would like your data to be.
If you have any questions or concerns, please feel free to contact us at any time. We are here for you!
Stay up to date with the latest news
Version 24.3 of EPOS is now available for download!
Read more
We're in the thick of developing our next release and we're excited to share the planned enhancements with you.
Read more
Transform your business with SAP Basis automation: EPOS makes it simple. Learn to save time and enhance productivity with our expert guide
Read more